On this page11
Bounce rate used to be the first number anyone looked at in Google Analytics, and one of the most misunderstood. In Google Analytics 4 it’s been redefined, and the new version is far more useful. Here’s how it works now, how to read it, and the changes that genuinely lower it.
How GA4 defines bounce rate
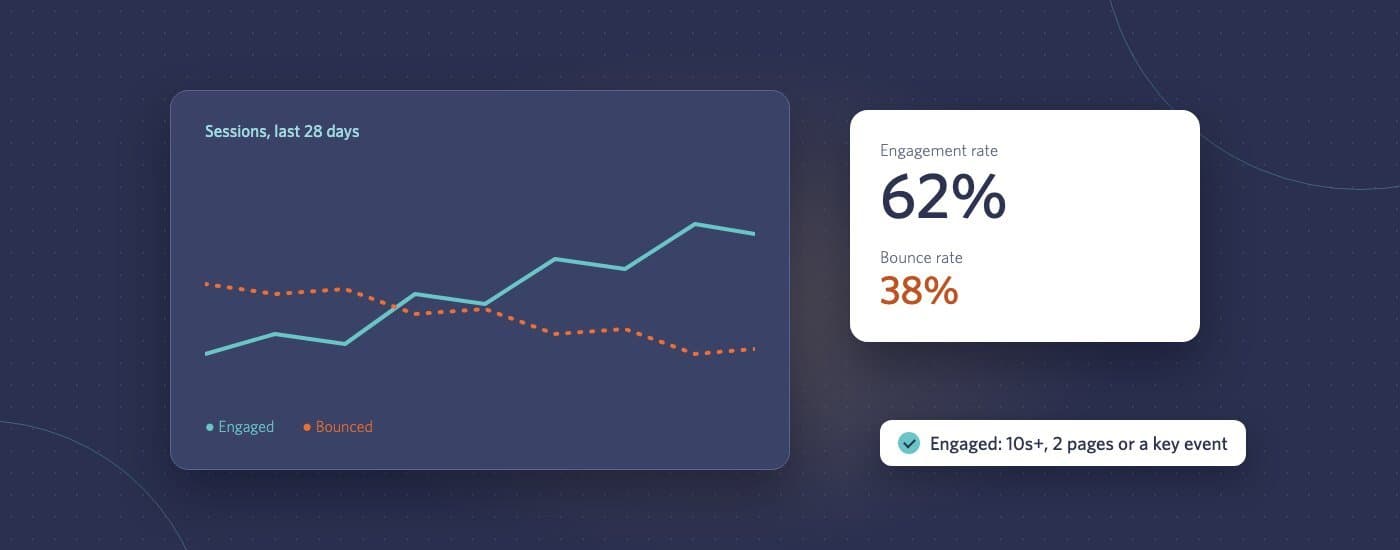
GA4 starts from the idea of an engaged session. A session counts as engaged if the visitor did at least one of these:
- Stayed for more than 10 seconds (the threshold can be changed)
- Viewed two or more pages or screens
- Triggered a key event, such as submitting a form
Engagement rate is the share of sessions that were engaged. Bounce rate is simply the opposite: the share that weren’t. So a 40% bounce rate means 60% of sessions were engaged.
This fixes the old definition’s biggest flaw. In the old version of Analytics, someone who read an entire article for five minutes and left counted as a bounce. In GA4, they’re engaged.
Where to find it
Bounce rate isn’t shown in most GA4 reports by default. Open a report such as Pages and screens or Traffic acquisition, choose Customize report, and add Bounce rate or Engagement rate as a metric. Explorations let you add it anywhere.
What’s a “good” bounce rate?
There isn’t one number. It depends heavily on the page’s job and where visitors come from:
- A contact page or a single long article can have a high bounce rate and still be doing its job
- Paid traffic and social traffic usually bounce more than search or email traffic
- Mobile traffic usually bounces more than desktop
Compare a page with itself over time, and with similar pages on your site, rather than with an industry average.
How to find the real problem
- Look at landing pages, not the site average. Sort by sessions and look for important pages with a much higher bounce rate than similar ones.
- Split by source. A page that performs well from search but badly from an ad usually has a mismatch between the ad’s promise and the page.
- Split by device. A big gap between mobile and desktop usually points to a layout or speed problem on phones.
- Watch real sessions. A session recording tool such as Microsoft Clarity shows what visitors actually do before they leave.
Changes that actually lower bounce rate
Load faster
Many visitors leave before a slow page finishes loading, and they never register as engaged. Getting the main content on screen quickly matters most. Our Core Web Vitals checklist covers where to start.
Match the page to the promise
The headline should confirm, within a second, that the visitor landed in the right place. If an ad says “pricing”, the page should show prices, not a company history.
Make the next step obvious
Give each page one clear next action, such as a button, a related article or a short form, placed where people finish reading, not only at the very bottom.
Fix the mobile experience
Check tap targets, font sizes, pop-ups that cover the content, and forms that are painful on a phone keyboard.
Make content easy to scan
Short paragraphs, descriptive subheadings and a summary near the top help visitors decide to stay.
One caution about the data
If your site uses a cookie banner, visitors who decline analytics may not be counted, or may be modelled rather than measured. Treat bounce rate as a trend to watch, not a precise figure.
If your bounce rate is high because pages are slow or awkward on mobile, that’s usually fixable without a redesign. Our fixed-price performance audit shows exactly what’s slowing your key pages down.